
Request a quoteFrom €1,200 excl. VAT
Rays GPRSurvey services

GPR survey in Belgium: know what is below before you dig.

We come to site with the radar and leave you with a report you can build on: targets marked with their depth, a plan you can overlay on your drawings, and a plain statement of how sure we are.

Belgium and neighbouring regionsReport in EN · FR · NLFrom €1,200 excl. VAT; travel listed separately in the quote
Illustration: on a city street, an engineer pulls our SHRS ground radar by its pole and checks the radargram on a rugged tablet, while a colleague marks the line of a pipe that was found on the asphalt
Illustration
KLIP · KLIM-CICC

Start with the utility plans, then decide

In Belgium the network operators' plans are requested through KLIP in Flanders and KLIM-CICC in Wallonia and Brussels. Ask for them first. Radar is for what the plans do not settle.

We survey across Belgium, in the Brussels-Capital Region, Flanders and Wallonia, and in neighbouring regions. Plans come in Belgian Lambert 2008, the report in English, French or Dutch. Read the guide to GPR utility detection →

01

What the plans give you

The public networks declared by their operators: gas, water, electricity, telecom and sewers, with an indicative position.

02

What they leave open

Private pipes and drains on the plot, abandoned lines, old tanks and foundations, and the real position and depth of what is drawn.

03

Where radar comes in

We survey with the plans in hand, confirm or correct the positions on the ground, and mark what was on no plan.

Check feasibility in thirty seconds

Three choices give you the antenna we would bring, what the ground is likely to allow, and the budget band. It is an indication, not a quote.

ANTENNA
400 MHz
FEASIBILITY

Good. A standard grid survey should resolve it.

BUDGET
From €2,000 excl. VAT
Send these details with a quote request

What you receive

Real deliverables from our projects. The findings are marked on the ground with spray paint or pegs, included in the survey price. Report in PDF and DOCX; the plan as a PDF in Belgian Lambert 2008 coordinates; data files on request.

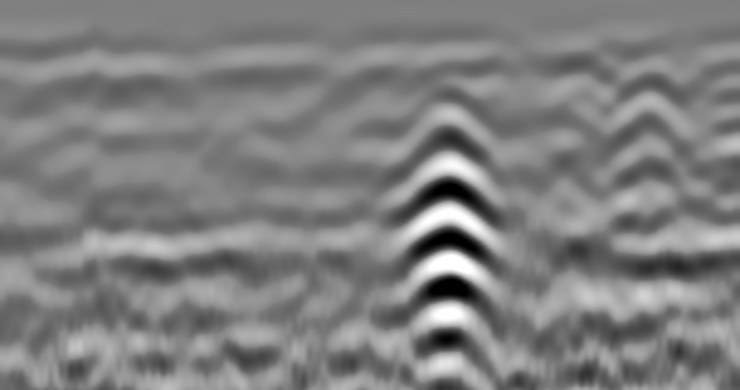
Annotated radargrams

Annotated radargrams

Every target marked on the processed profile, with its depth and a confidence grade.

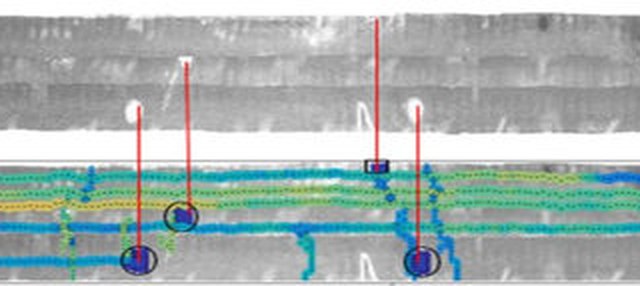
Depth-coloured plan

Depth-coloured plan

Pipes and objects drawn in plan view and coloured by depth, tied to manholes and fixed points.

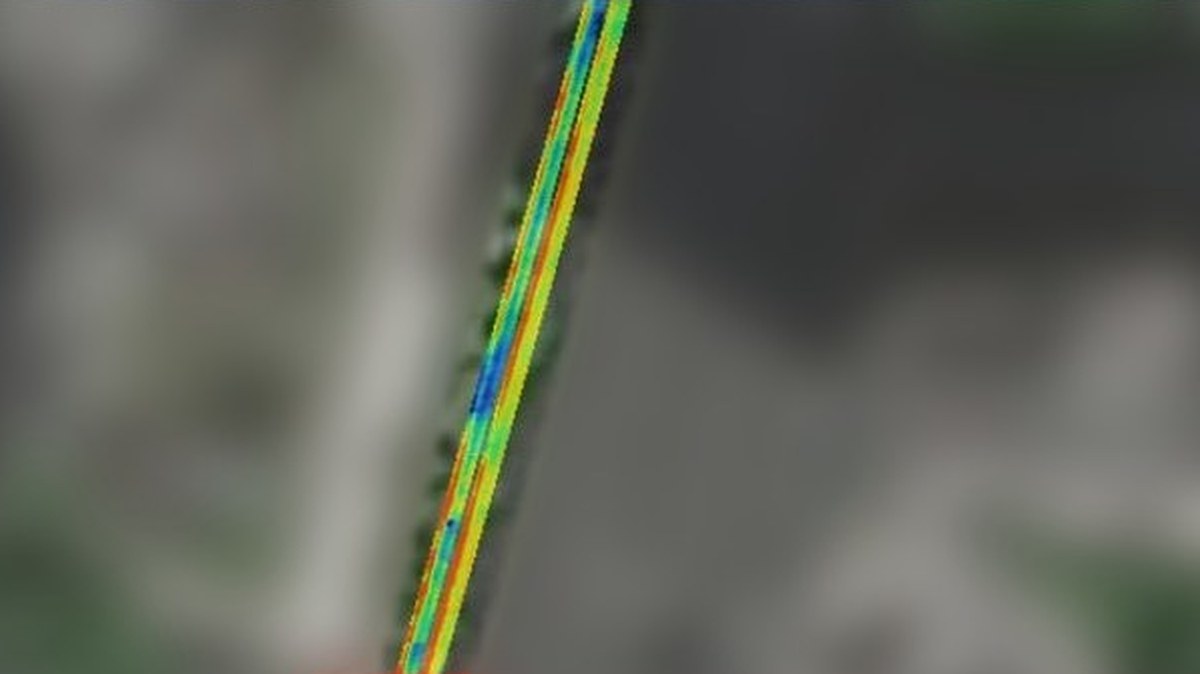
Map overlay

Map overlay

Time slices laid over the site map or your drawing, so the works team reads it directly.

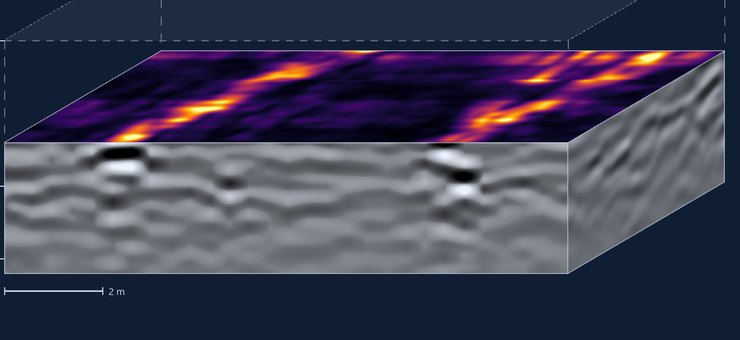
Depth slices and 3D

Depth slices and 3D

For gridded surveys: slices at chosen depths and a 3D volume you can open in the browser.

How a survey runs

  1. 01 · SCOPING CALL
  2. 02 · FIELD ACQUISITION
  3. 03 · PROCESSING
  4. 04 · INTERPRETATION
  5. 05 · REPORT AND HAND-OVER
What happens at each step
01 · SCOPING CALL

Site plan, targets, access, soil — we choose the antenna and tell you what is realistic.

02 · FIELD ACQUISITION

Gridded lines tied to fixed points or GPS, usually half a day to one day on site.

03 · PROCESSING

Gain, filtering and migration in our own software; 3D volume where the grid allows.

04 · INTERPRETATION

Targets, depths, confidence grades, cross-checks against your drawings.

05 · REPORT AND HAND-OVER

Report and plan, with a call to walk you through the findings.

Budget bands

Small jobs are priced by mobilisation and reporting, not by the square metre. Prices exclude VAT.

Single target

from €1,200 excl. VAT€1,452 incl. 21% VAT

A tree root zone, one or two manholes, a tank cover. Half a day on site, short report.

One site, area or line

from €2,000 excl. VAT€2,420 incl. 21% VAT

Locating pipes, a tank, a gallery or old foundations on one plot. Several targets possible. One day on site, overlay plan and report.

Larger sites and deep infrastructure

Several zones or industrial site

quoted

Multiple zones, CAD deliverables, site safety procedures. Priced per zone after a scoping call.

Deep or large infrastructure

feasibility first

A test section with a low-frequency antenna, then a full survey if the test succeeds.

A typical building plot, up to about 1,500 m²: €2,000 to €3,000 excl. VAT (€2,420 to €3,630 incl. VAT).

Every quote lists field time, processing, reporting and travel separately.

See how a survey runs, in five minutes

Demonstrated in our own GPR simulator, from the utility plans to the report. About the simulator →

Subtitles

The site and data in this video are simulated, not measured. English narration with a synthetic voice.

Real projects, anonymised

Client names, addresses and locations withheld. The table is a representative selection, not every survey: 16 surveys carried out and 1 ordered. Surveys are offered in Belgium and neighbouring regions.

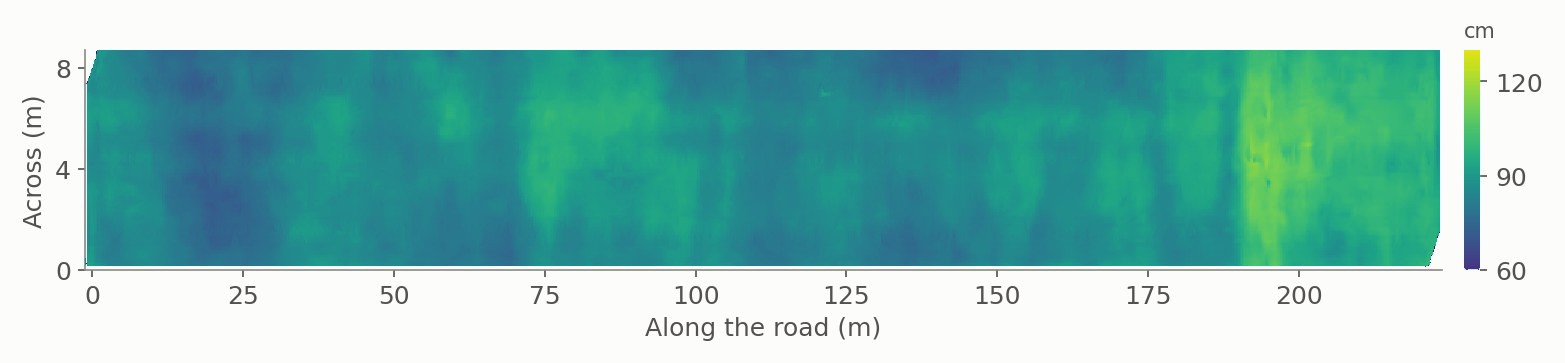
Base-course thickness map of a 90 m road section, with the suspected collapse zone marked
Road · Storm drain

A hidden collapse zone under an intact road surface

Surface intact, no cracks. A 90 m × 6 m section (540 m²) scanned with a 400 MHz 3D radar: cracked base course at about 0.2 m, and a suspected collapse zone 8 m long, its top about 1 m deep, beside a storm drain, with settlement over some 26 m. The radar reached 2.5–3 m, not the culvert below, and the report said so: a deeper low-frequency survey and a camera inspection of the culvert were recommended, and the lane closed in the meantime.
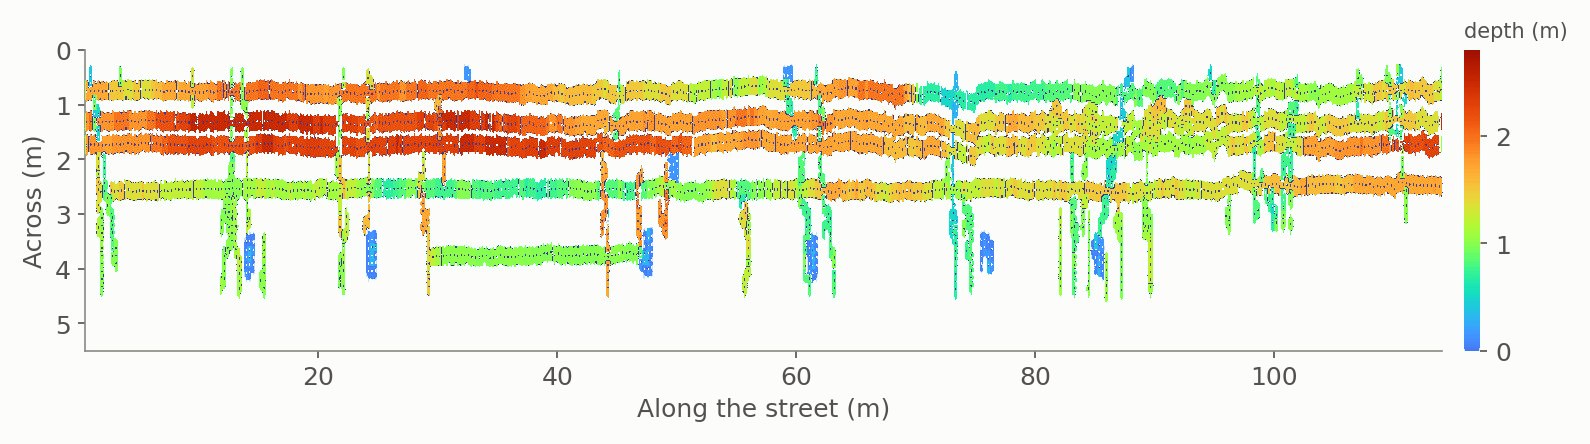
Pipe depth map along a street, from the radar profiles
Road · Sewer network

Pipe depths along a street, tied to the manholes

Profiles along the street, tied to the sewer manholes visible on the surface; pipes picked on each radargram and plotted on a depth map next to the road-surface image, so it is clear which manhole feeds which run. Median depth 1.37 m, standard deviation 0.52 m — a spread worth knowing before deciding where to dig.

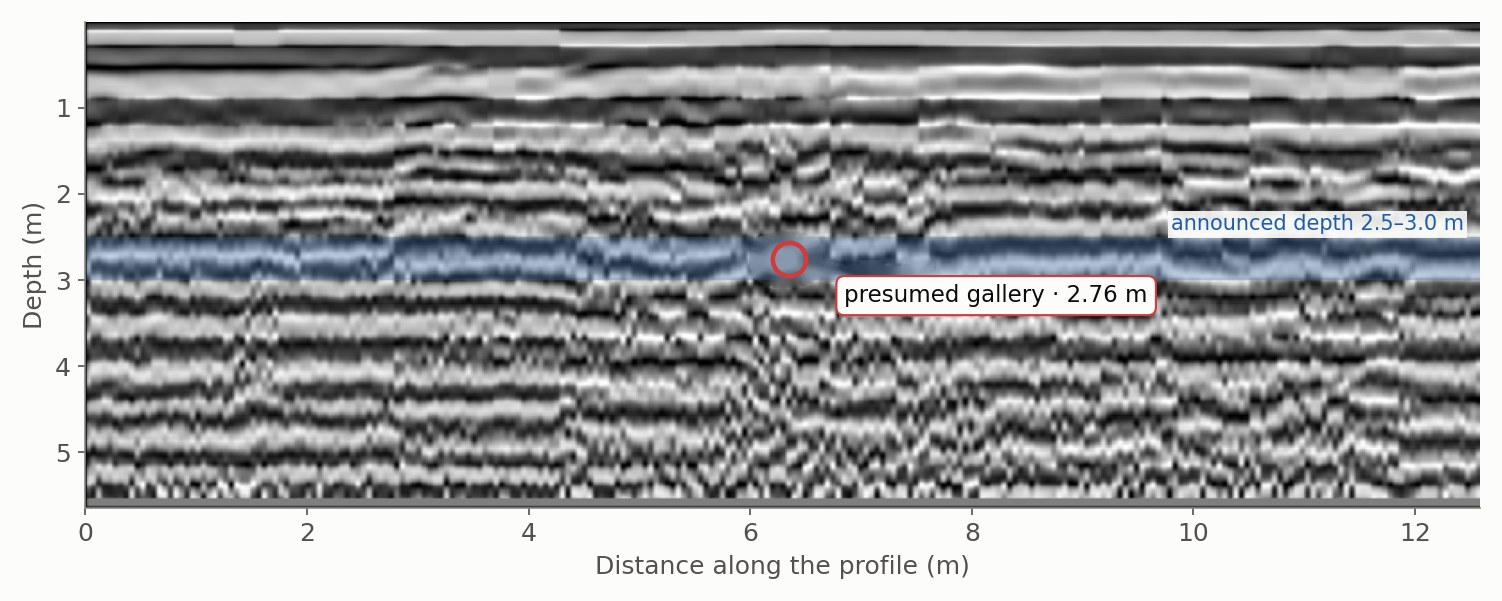
Processed 200 MHz radargram; the presumed gallery is picked at 2.76 m, inside the announced 2.5–3.0 m depth band
Utility gallery

A buried gallery located, at the limit of what the ground allowed

Forty 200 MHz profiles over a plot crossed by a masonry gallery announced at 2.5–3 m. The wave velocity was calibrated from the data (0.113 m/ns) and the useful depth measured on site (2.83 m), so the target sat right at the limit. The gallery was located on 8 profiles from a local break in the layering, not a textbook hyperbola: its axis runs 3.4 m from the route drawn on the plan, parallel to it within 0.5°, at 2.46–2.92 m depth, inside the no-build zone. The report states the fit scatter (± 0.19 m) and what it does not cover.

Thickness map of a car park floor slab, one block, measurement lines 0.3 m apart
Building · Underground car park

Slab thickness, moisture and void risk across a car park floor

Four zones on lines 0.3 m apart. For each block the report gave the structural layer thickness (block averages 26–35 cm, from 18 to 45 cm overall), the surface layer, moisture-risk areas beneath it and the risk of voids or debonding. A core through the 13 cm surface layer served as a check.

Time-slice overlay on the site map showing two parallel pipes and a crossing
Urban road

Two parallel pipes and a crossing, on the map

Time slices at 0.5 m overlaid on the site map: two parallel pipes follow the road and a third crosses them — a plan the works team could use directly.

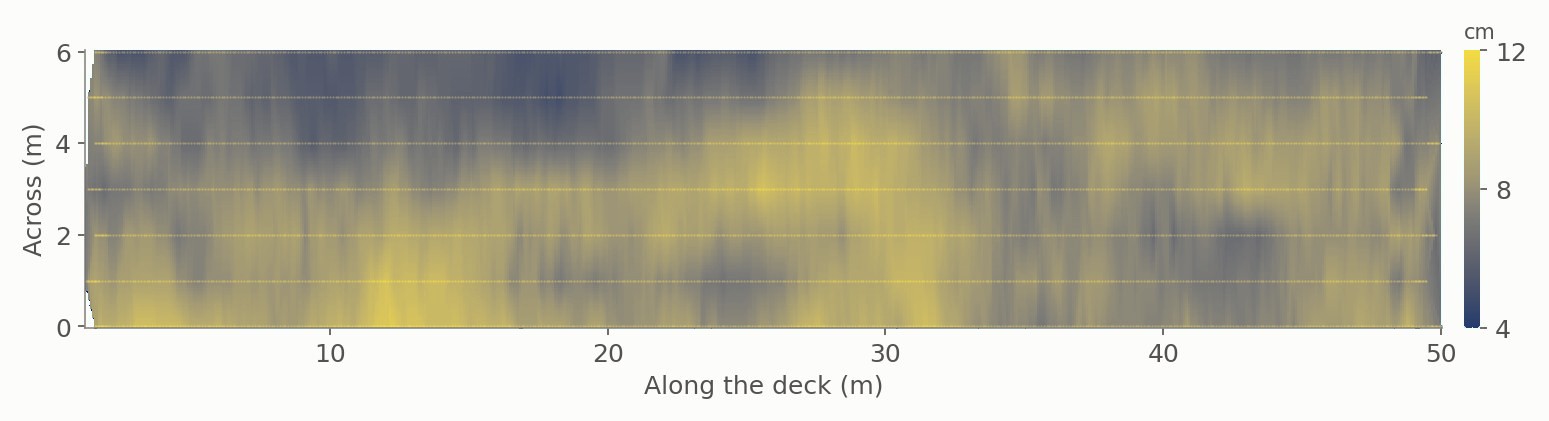
Asphalt thickness map over a 50 m bridge deck
Bridge · Hollow-core slab deck

Every layer of a bridge deck, read from the surface

Transverse and longitudinal lines on an orthogonal grid over the deck. On the reference profile: two asphalt layers of 11.8 and 9.2 cm, a 10.3 cm cast-in-place slab, a 6.9 cm slab top and the 44.8 cm void of the hollow core. The readings pointed to frequent debonding between layers and one zone with no concrete cover over the rebar. Ten cores were taken for calibration; the interface between the cast-in-place concrete and the slab gave little contrast and was reported as indicative only.

More cases
Base-course thickness map along the carriageway, used to place the cores
Road · Pavement condition

Ten cores, placed where the radar pointed

Seven 400 MHz runs over the carriageway, mapped for debonding between layers, cracking, loose zones, voids, settlement and moisture. The maps were used to choose ten core locations, which then checked layer thickness, moisture content and defects — so the radar readings were calibrated, not assumed.

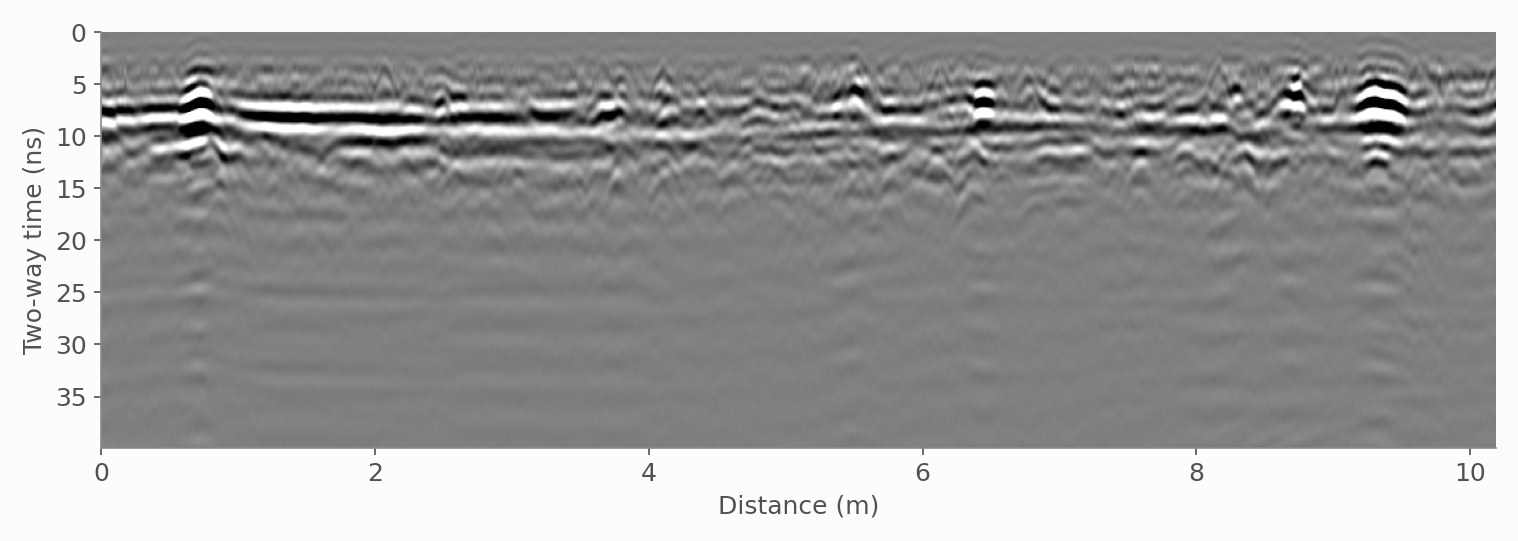
Low-frequency radargram of the road beside the excavation, two-way time axis
Deep excavation · Adjacent road

Screening the road beside a deep excavation

About 200 m × 16 m of road along a building pit, surveyed in two passes, with one view from 0 to 2 m and one down to about 10 m. Suspected risk zones — layer defects, debonding, voids — were outlined for the contractor and checked by core drilling. The plan set a repeat survey after one month, and every 15 days where a risk showed.

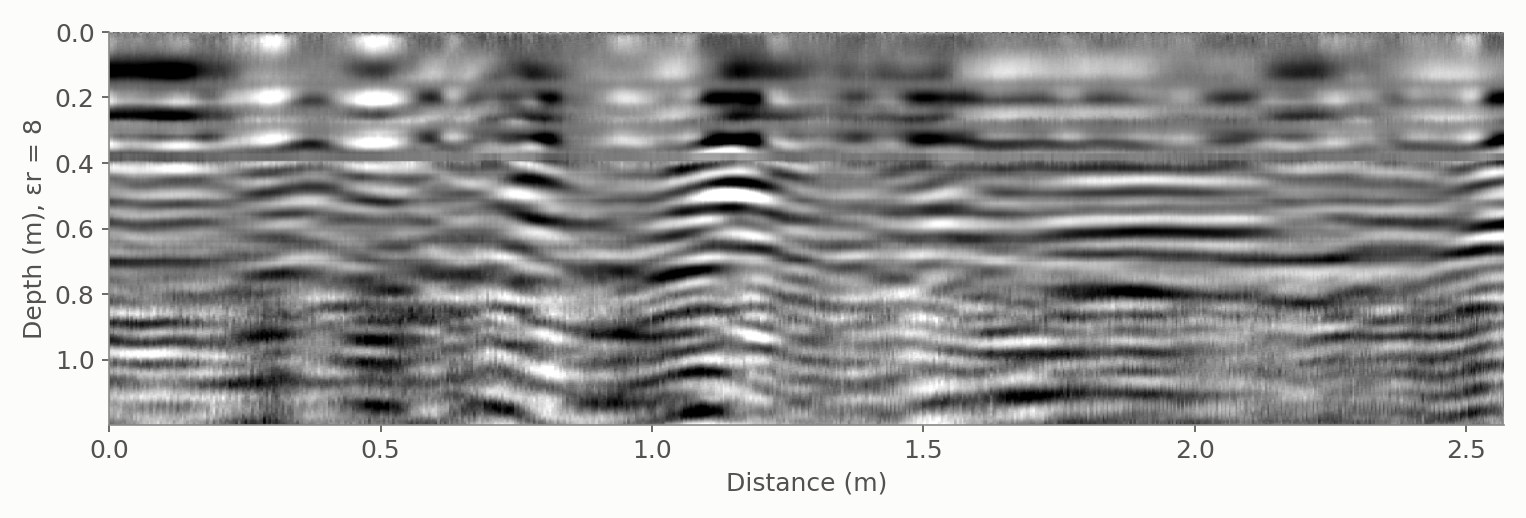
Radargram across the basement slab, depth axis for a relative permittivity of 8
Building · Residential basement

Rebar spacing that did not match the rest of the slab

Two basement levels scanned line by line. Slab about 17 cm thick, two rebar layers about 13 cm apart, bars mostly about 18 cm apart — but about 37 cm in part of the lower level. There the slab sagged locally, a wet zone showed beneath it, and a strong reflector at about 2.3 m pointed to the water table. Depths assumed a relative permittivity of 8, and the report says so.

SiteTaskAntenna · dataStatus
Municipal green spaceRoot zone and soil anomalies around a protected old hornbeam, for a tree-expert file400 MHz gridCommissioned
Heritage estateFoundations of a 1928 building located from the original deed plans400 MHz · 31 profilesSurveyed
Utility galleryLocate a buried service gallery along its presumed route200 MHz · 40 profilesSurveyed · gallery located
Urban utility networkPipe inspection—Surveyed
Industrial sitePipe inspection, manhole-tied profiles70 profilesSurveyed
Urban roadPipe inspection with a commercial multichannel array system8 channels · positionedSurveyed
Utility networkUtility pipe mapping in gridded swaths with a commercial multichannel array system, delivered as a pipe depth map10 channels · gridded swathsSurveyed
Building basementReinforced slab: rebar, voids and moisture, with a full reportDual-frequency · ~100 lines at 0.3 mSurveyed
BridgeDeck on hollow-core slabs: layer thickness and voids, with cores taken for calibrationOrthogonal grid · transverse and longitudinal linesSurveyed
Metro tunnelTunnel lining thickness and reinforcement600 MHzSurveyed
RoadPavement layer assessment with a commercial multichannel array system: layer thickness and moisture400 MHz · multichannelSurveyed
Electrical substationLocating the conductors of the grounding grid with a commercial multichannel array systemGridded surveySurveyed
BuildingRebar mapping in floor slabs—Surveyed
BuildingMoisture assessment of masonry walls—Surveyed
Heritage burial siteLocating grave structures—Surveyed
RoadSubsidence and collapse screening around a storm drain400 MHz 3D array · 90 m × 6 mSurveyed
Deep excavationScreening the adjacent roads for voids and debonding, checked by coresLow + high frequency · 2 passesSurveyed
Show the full project log (17)

Status: Surveyed — carried out by us on site. Commissioned — ordered by the client, survey still to be carried out.

What radar cannot do

We would rather lose a job than promise a result the ground will not give.

01

Wet clay and saline soil

They absorb the signal. Reach can drop to a third of what the same antenna achieves in sand.

02

Small plastic pipes

Below about 50 mm, or empty, they often give no usable reflection.

03

Below dense reinforcement

A tight rebar mesh reflects most of the energy; what lies under it may stay hidden.

04

Depth is an estimate

Depth comes from the wave velocity in your soil. We calibrate where we can and state the uncertainty.

05

Live cables

Radar can show where a cable runs, not whether it is live. Live cables are best confirmed with a cable locator; the quote says when one is needed.

Request a quote

Tell us the site and the target. An engineer replies within one working day, with a fixed price or a question.

* required

Reply within one working day · no obligation

Or call +32 (0) 491 08 61 09

Plans and photos help: you can send them in reply to our first email.

We use these details only to answer your request. Privacy policy

Who comes to your site

Dr. Borui Guan

Founder · lead GPR engineer

PhD in electronic engineering and twelve years in ground penetrating radar, from radar design to field surveys and the processing software we use. He carries out every survey and signs every report.

Reports and company details
  • Reports in English, French or Dutch
  • Rays Technology · Brussels · VAT BE 0797.331.189
  • KBO/BCE 0797.331.189 — sole trader (natural-person enterprise)

Frequently asked

How fast can you come to site?

Our first reply gives the first available survey date. The survey date and the report date are then fixed in the quote; tell us your deadline and we plan around it.

Do you mark the findings on the ground?

Yes. Pipes, cables and other findings are marked on site with spray paint or pegs, and this is included in the survey price. The plan follows as a PDF in Belgian Lambert 2008 coordinates.

Do you work outside Belgium?

Surveys cover Belgium and neighbouring regions of France, the Netherlands and Luxembourg.

More questions
Do we need to prepare the site?

Clear access to the survey area and any drawings you have. Parked cars, stored material and standing water are what most often cost time.

Who arranges signage and permits on public roads?

The client or the road authority arranges the road-works permit and the signage as required. We work within the agreed traffic arrangement, and the quote says what we need from you.

See what is under your site

A scoping call is free and takes fifteen minutes.